Caregiver Statistics: A Data Portrait of Family Caregiving
16 minute readLast updated June 15, 2023
Written by Claire Samuels
Reviewed by Erin Martinez, Ph.D.Dr. Erin Martinez is an associate professor of gerontology and director of the Center on Aging at Kansas State University, where she focuses on promoting optimal aging.
More info
Nearly 17% of the U.S. adult population provides unpaid care to an adult over the age of 50. More than 75% of these caregivers are women, and on average they spend almost an equivalent number of hours a week providing care as people traditionally spend at a full-time job. Many of these caregivers are also employed or raising children of their own. Other unique caregiver demographics include age, race, education status, and more.
Let our care assessment guide you
Our free tool provides options, advice, and next steps based on your unique situation.
41.8 million people in the U.S. provide care to seniors — that’s nearly 17% of the adult population in the United States.
Most family caregivers are unpaid, according to unpaid versus paid caregiver statistics which show that most family members aren’t compensated for providing care.
Family caregiving is almost a full-time job, with the average time spent on direct caregiving duties at 37.4 hours per week.
Alzheimer’s caregiver statistics differ from those of non-dementia caregivers, as people caring for relatives with dementia experience more burnout plus physical and emotional stress.
Key facts about family caregiver statistics: An introduction
According to our research team’s analysis of the latest available data:
In 2020, 41.8 million Americans provided unpaid care to an adult over the age of 50. That’s nearly 17% of the U.S. adult population.
89% of caregivers provide care for a relative or other loved one, such as a spouse.
23.7 hours per week is the average amount of time caregivers spend providing unpaid care for loved ones they don’t live with; those who live with their care recipient spend 37.4 hours a week.
More than 75% of all caregivers are female.
The average caregiver is 50.1 years old.
Caregivers provide an estimated $470 billion in free labor each year.
Read further for breakdowns on demographics, burnout rates, and more.
Unpaid caregiver statistics
Family caregivers work long hours and are often unpaid for their time spent supporting loved ones. Many of these caregivers also have full-time jobs and other responsibilities, like raising children, volunteering, and doing housework and chores.
Unpaid family caregiving is on the rise
The number of unpaid family caregivers in the U.S. increased by 9.5 million between 2015 and 2020, from 43.5 million to more than 53 million. These numbers reflect a consistent increase in caregivers over time.
It’s important to note that not all unpaid caregivers assist seniors. The data above applies to caregivers of all adults, including younger adults with physical or mental disabilities.
However, a majority of the caregivers represented do support seniors. More than 41.8 million of the represented group care for people over the age of 50.
Unpaid caregiving can be long term
The average length of time a caregiver provides unpaid care to a loved one is 4.5 years.
Seniors with acute conditions may only require temporary care. For example, someone may have fallen or had surgery and they only need short-term care until they’ve healed enough to support themselves independently.
On the other end of the spectrum are seniors with persistent disabilities — diabetes, a stroke, loss of vision — that leave them unable to care for themselves in the long term. 11% of care recipients require assistance for more than 10 years.
The number of people providing care for five years or longer has increased from 24% in 2015 to 28% in 2020. As life-extending technologies improve, this number will likely grow.
Most unpaid caregivers are related to their care recipients. They often live near their loved ones, and they spend 20+ hours a week on active caregiving.
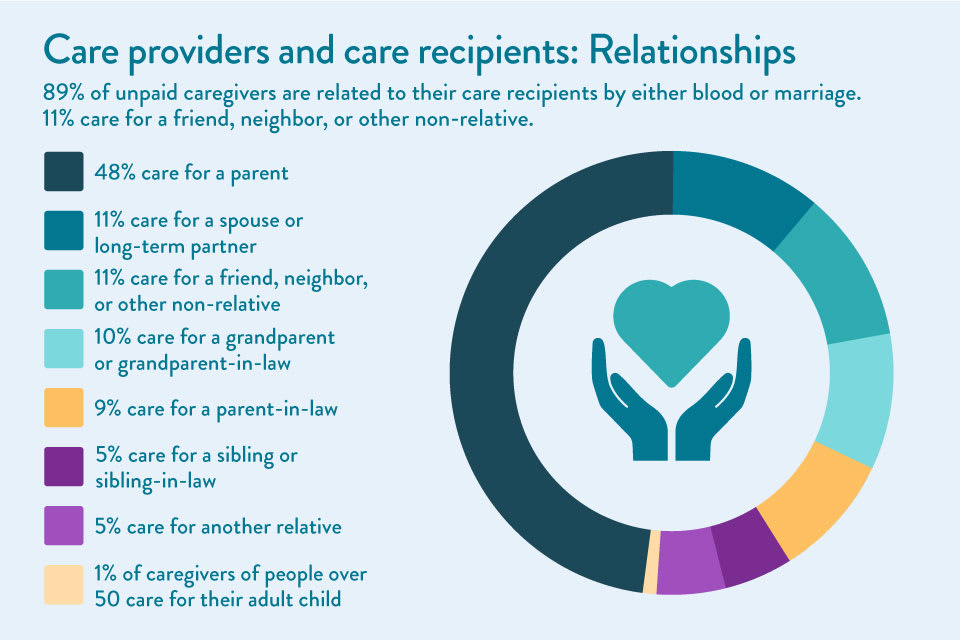
Relationships between caregivers and their loved ones
89% of unpaid caregivers are related to their care recipients by either blood or marriage. 11% care for a friend, neighbor, or another non-relative.
48% care for a parent.
11% care for a spouse or long-term partner.
10% care for a grandparent or grandparent-in-law.
9% care for a parent-in-law.
5% care for a sibling or sibling-in-law.
5% care for another relative.
1% of caregivers of people over 50 care for their adult child.
Between 2010 and 2020, the percentage of people caring for a spouse or partner remained steady. The number of people providing unpaid care to a non-relative dropped from 14% to 11%.
Time spent providing care
Family caregivers who live with their senior relative receiving care spend an average of 37.4 hours a week on direct caregiving duties. People who don’t live with their relatives spend an average of 23.7 hours a week on caregiving duties.
Note that these hours, which are almost equivalent to the number of hours worked in a standard full- or part-time job, don’t include passive time spent with care recipients. They encompass:
Activities designed for the care recipient that the caregiver would not normally do, such as low-impact senior exercises in the home, reminiscence therapy, and craft projects
Let our care assessment guide you
Our free tool provides options, advice, and next steps based on your unique situation.
Caregiver demographics: Age, location, professional, and economic status
Caregivers in the U.S. aren’t a homogenous group. They differ in age, race, profession, and more.
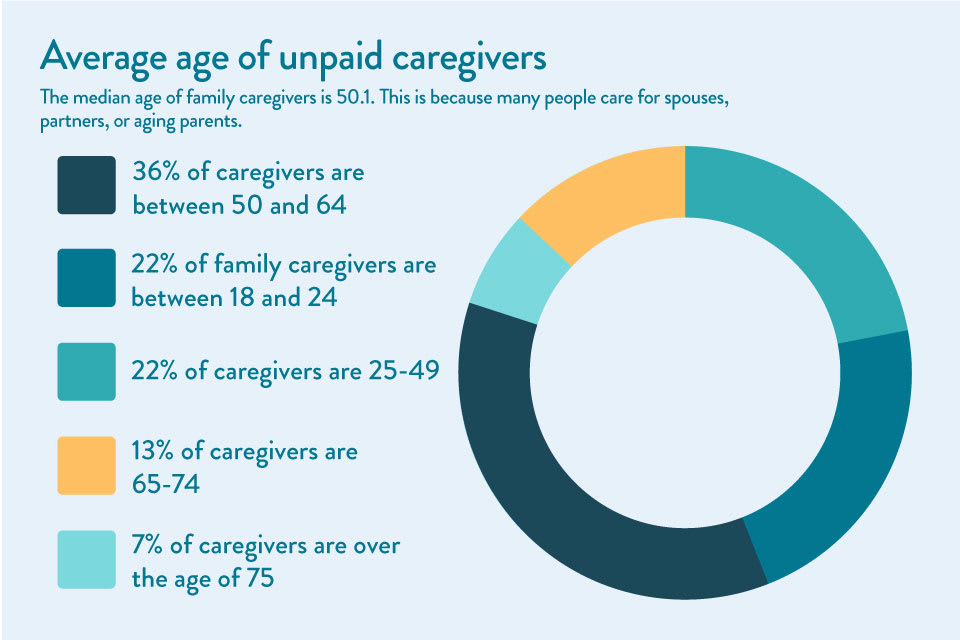
Average age of unpaid caregivers
The median age of family caregivers is 50.1. This is because many people care for spouses, partners, or aging parents.
22% of family caregivers are between 18 and 24.
22% of caregivers are 25-49.
36% of caregivers are between 50 and 64.
13% of caregivers are 65-74.
7% of caregivers are over the age of 75.
Marital status of family caregivers
The marital status of family caregivers of adults over 50 has changed significantly over the past 10 years. As of 2020, far more caregivers had never been married than in 2010. Here are the marital status percentages rounded to the nearest numbers:
60% of caregivers are married or in long-term domestic partnerships.
23% are single or never married.
9% are divorced.
3% are widowed.
2% are separated.
Family caregiver education status
The vast majority of unpaid caregivers finished high school, and most have completed at least some college. Here are the education statistics rounded to the nearest numbers:
6% of caregivers didn’t complete high school.
25% are high school graduates with no secondary education.
34% have attended either a technical school or some college.
21% are college graduates.
Over 15% have completed graduate school or other tertiary education.
Family caregiver employment status
As of 2020, 62% of family caregivers were employed while caring for someone over age 50, while 38% were not employed. This striking statistic is partially due to caregiver age, as 20% of caregivers are over retirement age.
Caregivers who are younger than 65 are more likely to work while caregiving (71%).
Caregivers who provide care for 20 or fewer hours a week are more likely to be employed (66%).
People providing care to a parent, grandparent, or in-law are more likely to work than those providing care to a spouse or partner.
Men are more likely to work while providing care than women.
54% of caregivers are employed hourly, while around 40% are salaried, and others report being self-employed or owning their own business.
Rural caregivers
About 30% of caregivers live in rural areas. Rural caregivers are most often white women. They have, on average, lower incomes and education statuses than their urban and suburban counterparts. They also often care for younger loved ones: The average care recipient age in rural areas is only 66.9.
While most care recipients in the U.S. are female, rural care recipients are more likely to be male. Rural care recipients are more likely to have a greater number of health conditions than care recipients in urban and suburban areas, and they often require more assistance with medical and nursing tasks.
Male caregiver statistics
Women provide the majority of care to seniors in the U.S. In fact, fewer than 24% of unpaid caregivers are men. That percentage is far higher than it used to be, as only 11% of family caregivers in 1995 were men. While statistics aren’t available for earlier years, it’s safe to assume that the percentage of male caregivers is trending upward as gender roles in society become more aligned.
Society tends to view women as more naturally nurturing than men. Until recent decades, men were more likely to work outside the home, making them less able to provide continuous care.
For sandwich generation caregivers, childcare and eldercare are often performed by the same parent. Because women also spend overwhelmingly more time on childcare, the responsibility of family caregiving may fall to them as well.
Military-connected status of caregivers
Caregiving may be more prevalent in military-connected families than in their civilian counterparts, according to the Blue Star Families’ (BSF) Caregiving in Military Families: 2020 Military Family Lifestyle Survey Special Report.
5.5 million people in the U.S. are military caregivers.
28% of those caregivers in military families are providing care for a parent or grandparent, while 35% are caring for a child with special needs.
With a mean caregiver age of 37 years old, military family caregivers are younger than caregivers in the overall U.S. population.
The demographics of military caregivers differ from their civilian counterparts in the following notable ways:
Expanded concept of “family.” Within the military subculture, the concept of family may include non-relatives in the military community, such as battle buddies, fellow unit members, fellow military spouses, and military children. As such, 15% of military-family caregivers provide care to a non-relative who is the spouse or child of another active-duty service member.
Invisible wounds. These military-connected caregivers are more likely than their non-military-connected peers to be caring for people with mental, emotional, and physical health issues.
Lack of health coverage. Almost one in three post-9/11 military caregivers do not have health care coverage or VA benefits. This lack of health coverage is twice that of civilian and pre-9/11 military caregivers, as noted by the RAND Corporation.
The majority of unpaid family caregivers in the U.S identify as non-Hispanic and white. However, a higher percentage of Asian American and Black U.S. residents provide family care than white residents do. While 75% of the U.S. population is white, 61% of caregivers are. Though only 13% of the U.S. population is African American, 14% of caregivers are.
61% of caregivers of someone age 50+ report being non-Hispanic white.
17% identify as Hispanic.
14% identify as African American or Black.
5% identify as Asian American or Pacific Islander.
3% identify as another race or ethnicity or multiracial.
African American and Black caregivers: A closer look
African American caregivers are, on average, younger than their counterparts, at 47.7 years old.
They are more often unmarried.
African American caregivers report lower household incomes than non-Hispanic white and Asian caregivers.
African American caregivers are more likely to be responsible for high-intensity care, providing 31.2 hours of care each week and assisting with multiple ADLs and IADLs as well as medical care.
Most African American caregivers also work a weekly average of 37.5 hours and are most likely to report a negative financial impact from caregiving.
Asian American and Pacific Islander caregivers: A closer look
Asian American caregivers are, on average, 49.3 years old.
They are more likely to live with a spouse or partner and reside in a multigenerational household.
Asian American caregivers report the highest education levels and household incomes of all racial and ethnic groups in the U.S.
They typically work for an average of 36.7 hours a week while providing care, and while they report taking more time off to support loved ones, they’re often in more salaried jobs and report fewer negative career impacts.
Hispanic caregivers: A closer look
At only 43.3 years of age, Hispanic caregivers are, on average, younger than any other U.S. demographic.
They generally live with a spouse or partner and are the most likely to also be caring for a child under the age of 18.
Hispanic caregivers typically work an average of 36.7 hours a week at an hourly-pay, non-salaried job, and they’re also likely to report a negative financial impact from caregiving.
Responsibilities of family caregivers and their impact on health and daily life
Caregiving is a difficult job that requires extensive time and energy. Family caregivers can be affected by their duties for years to come.
10 main reasons seniors need family care
Each family’s care situation is different. These are the top 10 reasons older adults require care:
16% “old age” or general infirmity
12% mobility assistance
11% Alzheimer’s disease or other types of dementia
6% cancer care
6% post-surgery or wound care
5% mental illness or emotional inability to care for themselves
5% post-stroke care
4% diabetes care
4% fall risk
3% blindness or vision loss
Caregiver duties and specialties
Every family has different care needs based on a senior’s medical status, ability to perform activities of daily living, and cognitive capacity.
99% of caregivers help with at least one IADL, like cooking, cleaning, laundry, or medication management.
60% help with at least one ADL, such as dressing, bathing, or using the toilet.
Over 90% help with transportation to and from appointments or activities.
Dementia and Alzheimer’s caregiver statistics
Less than half of family caregivers — about 16 million — assist a person with dementia. They often have more demanding caregiving duties on top of the assistance mentioned above. They’re more likely to provide “high-intensity care,” according to the level-of-care index providers use to determine the amount of time spent caregiving. Dementia caregiver statistics vary from those of non-Alzheimer’s caregivers.
Over half of dementia caregivers provide care for four years or more, significantly longer than family caregivers for people with other age-related diseases.
People with dementia typically require more supervision and are less likely to express gratitude for the help they receive (due to inability). As a result, caregivers are more likely to be depressed.
Dementia caregiving increases mortality risks, even for healthy caregivers. Despite a significantly lower risk of mortality at the start of care, 18% of healthy spouse caregivers die before their partner with dementia, according to data culled from the Kaiser Family Foundation’s Health and Retirement Study.
Talk with a Senior Living Advisor
Our advisors help 300,000 families each year find the right senior care for their loved ones.
Long-term health effects of caregiving
Caregiving can be a rewarding role that helps form bonds between generations. However, it may significantly affect the physical and mental health and well-being of caregivers over time through caregiver burnout.
Unpaid family caregiving for 20 hours or more a week results in impaired self-care for the caregiver, increased depression and psychological distress, and worse self-reported health, according to 2018 research conducted by Maastricht University.
Caregiver depression increases as the elderly relative’s level of function declines. An estimated 30-40% of dementia caregivers and others providing high-intensity care experience depression.
Only four in 10 caregivers would rate their health as “excellent or very good,” according to AARP’s 2020 Caregiving in the U.S. survey.
53% of caregivers have been diagnosed with two or more chronic conditions. That’s 14% higher than the general U.S. adult population, according to the CDC.
Nearly half of caregivers are concerned about the physical strain that comes with caregiving, according to a survey from SCAN Health.
44% are concerned about the emotional strains of caregiving, according to the SCAN Health survey.
Financial impact of family caregiving
On average, family caregivers spend $7,242 annually, or 26 percent of their income, on providing care to a senior loved one. 22% of caregivers report using all their short-term savings, while 12% percent say they went through all their long-term savings while taking care of elderly parents at home, according to an AARP report.
Caregivers who are retired or no longer working may go through their savings even more quickly, leaving themselves with little money for care as their health needs increase over time.
Caregivers may incur extra expenses like:
Higher utility bills
Extra groceries
Medical needs, such as prescription medication and bandages
Accessibility devices, including hearing aids, wheelchairs, and walkers
Incontinence supplies
Transportation-related costs
Clothing and personal care needs
Home modifications
Next steps for family caregivers
If you’re currently providing unpaid care for a loved one and feel like you could benefit from additional support, learn how to become a paid family caregiver. If caregiving has become too much, consider senior living care options such as assisted living or long-term care at home to help your relative age safely and also reduce your likelihood of caregiver burnout.
Reach out to one of A Place for Mom’s Senior Living Advisors to explore these options. These advisors can go over your budget, preferences, and needs to help find the best fit for your loved one — all at no cost to your family.
Claire Samuels is a former senior copywriter at A Place for Mom, where she helped guide families through the dementia and memory care journey. Before transitioning to writing, she gained industry insight as an account executive for senior living communities across the Midwest. She holds a degree from Davidson College.
Haines Eason, a sandwich generation caregiver, is a former senior copywriter and managing editor at A Place for Mom, where he covered nearly all senior-relevant topics. He holds bachelor’s and master’s degrees from the University of Montana and Washington University in St. Louis, respectively.
Dr. Erin Martinez is an associate professor of gerontology and director of the Center on Aging at Kansas State University, where she focuses on promoting optimal aging.
The information contained on this page is for informational purposes only and is not intended to constitute medical, legal or financial advice or create a professional relationship between A Place for Mom and the reader. Always seek the advice of your health care provider, attorney or financial advisor with respect to any particular matter, and do not act or refrain from acting on the basis of anything you have read on this site. Links to third-party websites are only for the convenience of the reader; A Place for Mom does not endorse the contents of the third-party sites.