Reviewed by Carol Bradley Bursack, NCCDP-certified dementia support group facilitatorAuthor Carol Bradley Bursack spent two decades as a primary caregiver to seven elders and is also a newspaper columnist, blogger, and expert on aging.
More info
According to our research team’s analysis of the latest available data:
Let our care assessment guide you
Our free tool provides options, advice, and next steps based on your unique situation.
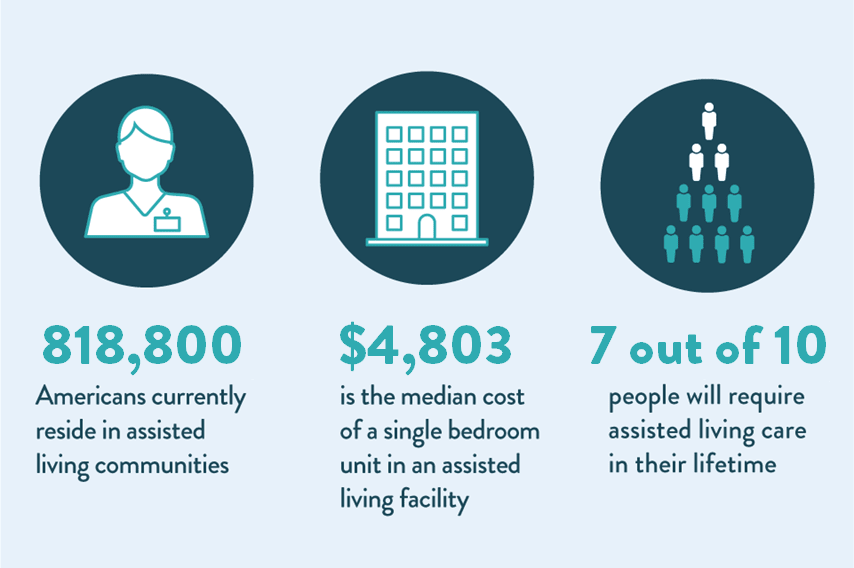
More than 818,800 Americans currently reside in assisted living communities, accounting for 88% of all senior residential care community residents.
There are over 30,600 active assisted living facilities, operating at an average capacity of nearly 80%.
The median cost of a private, single bedroom unit in an assisted living facility is $4,803 per month.
With 7 out of 10 people requiring assisted living care in their lifetime, demand is expected to grow by an additional one million beds by 2040.
Read on for breakdowns on resident demographics, the cost of care, and more.
Assisted living resident population statistics
More than 818,800 Americans currently reside in assisted living communities. That’s about 2% of seniors over the age of 65.
Assisted living as a concept is still relatively new. For a long time, nursing homes were the only senior care option available. However, in the 1980s, a more person-centered care model was born — enter assisted living.
Over 30,600 assisted living facilities exist in the United States, with nearly 1.2 million licensed beds available, according to the National Center for Assisted Living (NCAL).
A rapidly growing senior population implies the need for additional assisted living communities, but so does the current generation of middle-aged adults who will require senior housing over the next several decades. Baby boomers are retiring with unprecedented financial assets and strong opinions about the future of senior living. Many want high-quality accommodations and care, in addition to the ability to explore personal passions and interests post-retirement.
From now until 2030, 10,000 baby boomers will reach retirement age each day. Many will seek assisted living options once they’re no longer able to care for themselves independently. By 2040, over 80 million people in the U.S. will be over 65 years old, with that number growing to nearly 95 million by 2060, according to the U.S. Census Bureau.
This near-doubling of the senior population is projected to necessitate almost 1 million additional assisted living beds over the next four decades.
State-by-state information on assisted living communities in the United States
With some states being more densely populated than others, it makes sense that some states will also have more assisted living communities than others. The following data can help you get a better sense of which states have the most and least number of assisted living communities. Note that this data is drawn only from A Place for Mom’s partner communities and is proprietary data.
The five states with the greatest number of assisted living communities are:
California
Texas
Florida
Washington
Ohio
The five states with the fewest number of assisted living communities are:
Alaska
Wyoming
North Dakota
Vermont
Montana
Assisted Living: What it is and who it helps
Assisted living communities offer long-term housing and care for seniors. Residents often need help with various activities of daily living (ADLs), such as dressing, bathing, and using the toilet, but they do not require 24-hour nursing or medical care. Assisted living provides companionship, personalized care, social activities, and nutritious meals to seniors in a safe, communal setting.
Someone turning 65 today has a seven-in-10 chance of needing some type of senior care as they age, according to the Administration for Community Living and Administration on Aging. With the over-65 population projected to double by 2060, the number of seniors requiring care will increase dramatically over the next four decades.
Assisted living resident demographics
Assisted living communities cater to a wide-ranging population of seniors from various backgrounds. Learn more about the average age, care needs, and length of stay for assisted living residents below.
Age demographics in assisted living
The average age of an assisted living resident is 87. While some people transition to assisted living communities as soon as they reach the age minimum, most wait until they need additional care, or until they can no longer remain in their own homes without assistance. Assisted living age requirements vary, but are usually set at 62 or 65 years of age. A small handful may work with those as young as 55.
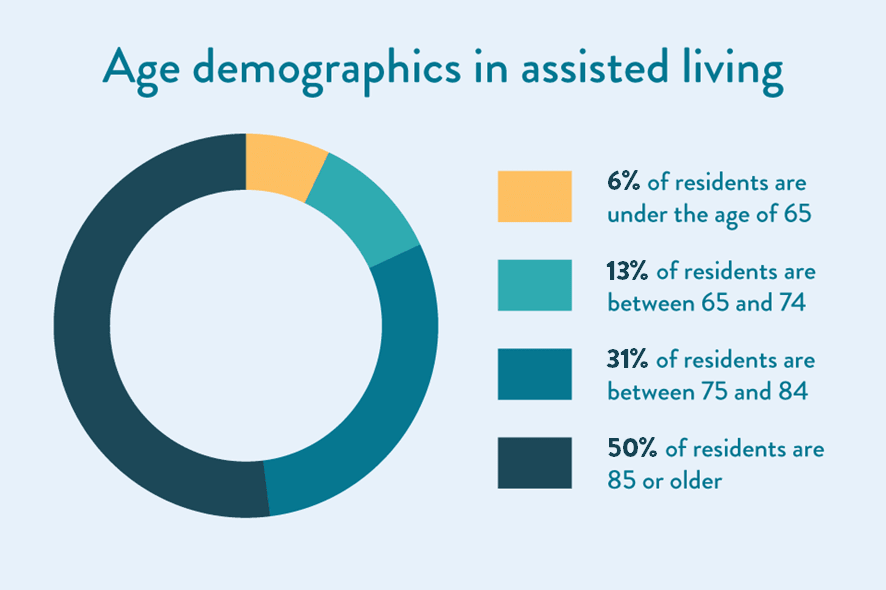
The majority of residents move into assisted living communities between the ages of 75 and 84, according to the National Association of Real Estate Investment Trusts. In 2023, the NCAL calculated the prevalence of primary age groups as follows:
6% of residents are under the age of 65
13% range between 65 and 74
31% of residents are between 75 and 84
50% of residents are 85 or older
Younger residents may move to assisted living to reap the benefits of a community setting, including group activities, exercise classes, nutritious meals, and reduced isolation. Older residents often require more assistance with ADLs but can still benefit from the active, independent lifestyle offered by assisted living.
Gender in assisted living
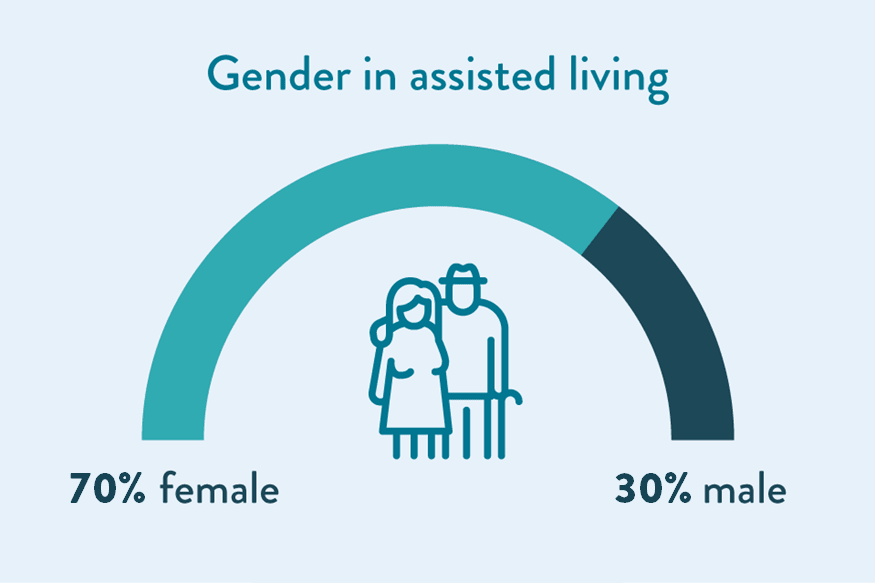
Women in the U.S. tend to live longer than men. The average life expectancy for women was reported to be 79.3 years as of 2021, while the average life expectancy for men was 74.2 years, according to the National Centers for Health Statistics. This disparity contributes to the high female-to-male ratio in assisted living communities.
Approximately 70% of assisted living residents are female, while 30% are male. There is no current data available about non-binary or genderqueer seniors. Here are some additional factors that contribute to the age disparity in assisted living, according to a study published in the journal Age and Ageing:
Women are, on average, five years younger than male spouses.
Women are more likely to outlive their male spouses.
Men are more likely to have comorbidities and chronic conditions that require more comprehensive medical care than assisted living communities provide.
Men are less likely to have the skills to care for a female spouse at home.
Racial disparity in assisted living communities
Assisted living communities and other long-term care facilities serve a predominantly white, non-Hispanic population, according to a study of 181 residential care and assisted living facilities published in the American Journal of Public Health.
About 60% of U.S. adults aged 60 and older self-identify as White and non-Hispanic, according to the U.S. Census Bureau. Strikingly, over 87% of assisted living residents self-identify as such, demonstrating the disparity between population statistics and assisted living metrics.
Though no comprehensive recent studies are available about race demographics specifically in assisted living — most focus on all long-term care facilities or nursing homes — these facts stand out:
Asian and Hispanic families are most likely of all major racial and ethnic groups in the U.S. to care for aging family members in multigenerational households, with the lowest number of seniors transitioning to communal care facilities before medically necessary.
BIPOC (Black, Indigenous, and people of color) seniors make up less than 10% of assisted living populations, but over 24% of nursing home populations.
White, non-Hispanic families are the least likely to care for an aging relative at home, and they are the most likely to seek senior living communities before medically necessary.
Socioeconomic impact on assisted living statistics
Socioeconomic status inequities strongly affect assisted living residency statistics. Lower-income seniors are more likely to have decreased quality of life, interrupted health care access, and fewer available resources to age comfortably in a community setting. Even middle-income seniors often rely on Medicaid to fund senior care, according to McKnight’s Senior Living.
Why does this affect assisted living statistics? Fewer than 50% of assisted living communities are Medicaid certified, and even those rarely accept Medicaid without additional payment from seniors and their families.
For this reason, only about 18% of assisted living residents rely on Medicaid, according to data from the American Health Care Association and the National Center for Assisted Living. That means the other 82% of seniors in assisted living communities are considered to be upper-middle- or upper-income individuals.
The poverty rate among older adults has decreased by two thirds since the early 1970s. However, as of 2019, nearly 5 million adults over the age of 65 live in poverty. That correlates to 8.9%, with women over the age of 80 reaching nearly 14%, and Hispanic and non-white seniors at even higher levels of poverty, according to the Congressional Research Service. People living below the poverty line, as well as many middle-income seniors who can’t afford paying for assisted living out of pocket, often must turn to in-home family care or state-funded nursing homes, rather than assisted living communities.
Health conditions and comorbidities in assisted living
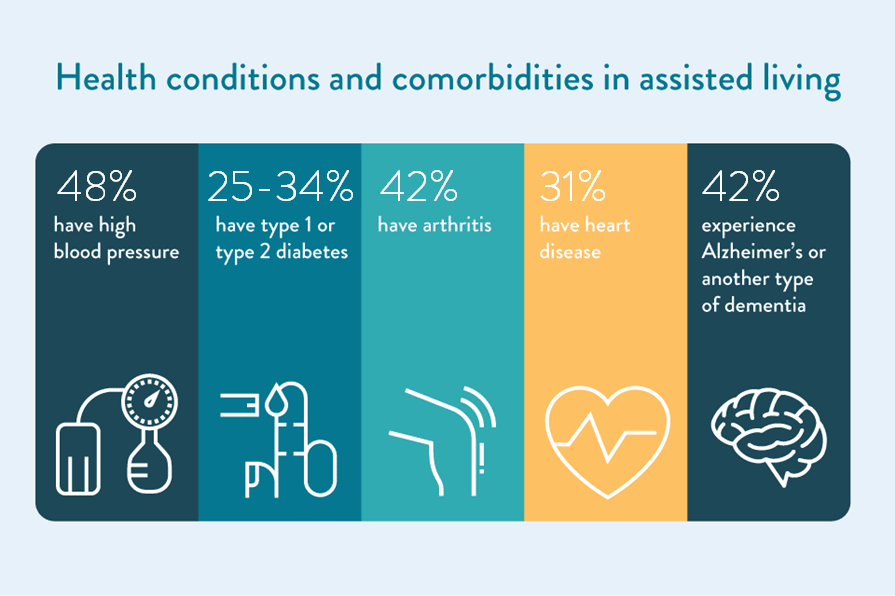
As people age, the likelihood of certain progressive diseases and conditions increases. Many assisted living residents require help with these conditions in addition to ADL assistance. Communities are prepared to assist seniors with various common comorbidities. According to U.S. Pharmacist and the NCAL, many assisted living residents experience these conditions:
42% of residents experience Alzheimer’s disease or another type of dementia.
42% of residents have arthritis.
31% of residents have heart disease.
25-34% of residents have type 1 or type 2 diabetes.
Many assisted living communities also offer health-related services that don’t target specific comorbidities but work to prevent future health concerns.
Nearly 84% of communities partner with a pharmacy or have an on-site pharmacist.
Nearly 83% offer nutritional guidance and meal plans from a registered dietitian.
Slightly more than 71% offer on-site physical, occupational, or speech therapy.
Approximately 55% of communities partner with mental health or counseling professionals.
Dementia care in assisted living
As the population ages and dementia becomes more prevalent, the percentage of assisted living residents experiencing cognitive decline increases. In 2019, 42% of seniors in assisted living had Alzheimer’s disease or another type of dementia, according to the Alzheimer’s Association 2020 Alzheimer’s Disease Facts and Figures report.
Our free tool provides options, advice, and next steps based on your unique situation.
To cater to this population, many assisted living communities have added memory care wings or sections. Approximately 29% of assisted living communities cater either exclusively to residents with dementia or offer secure, separate environments for memory care.
What services do assisted living residents require?
Many assisted living communities have entry requirements a senior has to meet before admittance. Generally, older adults must require help with at least two ADLs but be able to walk or perform transfers — move from a bed to a wheelchair and back — and swallow without assistance. Many assisted living residents need help with the following ADLs:
64% need help with bathing
50% need assistance walking, whether from a care aide or mobility device
49% need help with dressing and grooming
43% need help using the restroom
22% require assistance eating, but can generally swallow independently
What is the average length of stay in assisted living communities?
The median length of stay in assisted living communities as of 2023 was 22 months according to the National Center for Assisted Living. Median numbers generally provide a more accurate figure than an average as it isn’t skewed by very high or low numbers. However, this amount of time has been quite variable over the past several years, with many factors contributing to these changes. These include:
Age. Seniors are opting to move into assisted living communities later. This may be because of delayed retirement, increased home safety amenities, finances, or because more home care options are available.
The COVID-19 pandemic. Many seniors delayed a move to assisted living during the height of the Coronavirus pandemic. Other families decided to pull their loved ones from communities until the pandemic subsided.
Financial concerns. As assisted living costs rise, some families may not be able to cope with rent increases. In some states, costs have risen, on average, several hundred dollars a month, according to Genworth’s annual Cost of Care Survey.
Changing care needs or dissatisfaction with care. Since seniors are moving into assisted living communities later in life, their care needs may change more rapidly. Depending on their needs, seniors may transfer from:
The assisted living industry has grown and changed enormously over the past 40 years, and it is projected to continue evolving as the population ages. Here are five key takeaways about the future of assisted living.
1. Senior living occupancy is on the rise.
Across the senior living industry, occupied units are at an all-time high, according to data from the National Investment Center for Seniors Housing and Care. Among all care types, assisted living had the largest quarterly gain with occupancy at 80.7%.
Senior living occupancy (including independent living, assisted living, and memory care) has an occupancy rate of 84.2% as of August, 2023.
Approximately 30,600 assisted living communities operate in the U.S., according to the most recent data from the NCAL. Within these communities, there are nearly 1.2 million registered beds. Since the population of people over the age of 65 is anticipated to nearly double by 2060, a comparable increase in assisted living communities is expected.
2. Assisted living is a multi-billion dollar industry.
The U.S. assisted living facility market size was valued at $91.8 billion in 2022 and is expected to expand at a compound annual growth rate of 5.53% from 2023 to 2030, according to Grand View Research market data.
3. Most assisted living communities are for-profit.
More than 80% of assisted living communities are for-profit. However, nonprofit communities continue to gain market share, according to Senior Housing News. Nonprofit communities are often smaller but have higher occupancy rates but perhaps fewer amenities than their larger, national-brand competitors.
4. Assisted living occupancy is increasing after the pandemic.
Between the fourth quarter of 2019 and the first quarter of 2021, the average occupancy at assisted living communities dropped from 87.9% capacity to 75.4% capacity, according to the Statista Research Department. This attrition was likely caused by families seeking other living arrangements during the COVID-19 pandemic.
Assisted living occupancy rose to more than 78% by the end of 2021, according to NIC MAP Vision data released in January 2022. As Coronavirus infection rates continue to decline, occupancy is expected to rise to pre-pandemic numbers.
5. Assisted living communities employ nearly half a million staff members.
As of January 2023, there were approximately 478,500 total employees in the assisted living profession, according to the NCAL. This number represents all staff members, including administrators, sales representatives, care aides, cooks, and custodial and maintenance workers. Among the 478,500, about 298,800 are employed full-time in nursing care or social work roles, including:
66% care aides
19% licensed practical or vocational nurses
15% registered nurses
0.8% social workers
Since assisted living facilities aren’t designed for comprehensive medical care, they rarely employ doctors but generally do provide transportation to nearby medical appointments. It’s important to inquire about assisted living staff-to-resident ratios when touring assisted living facilities.
How much does assisted living cost?
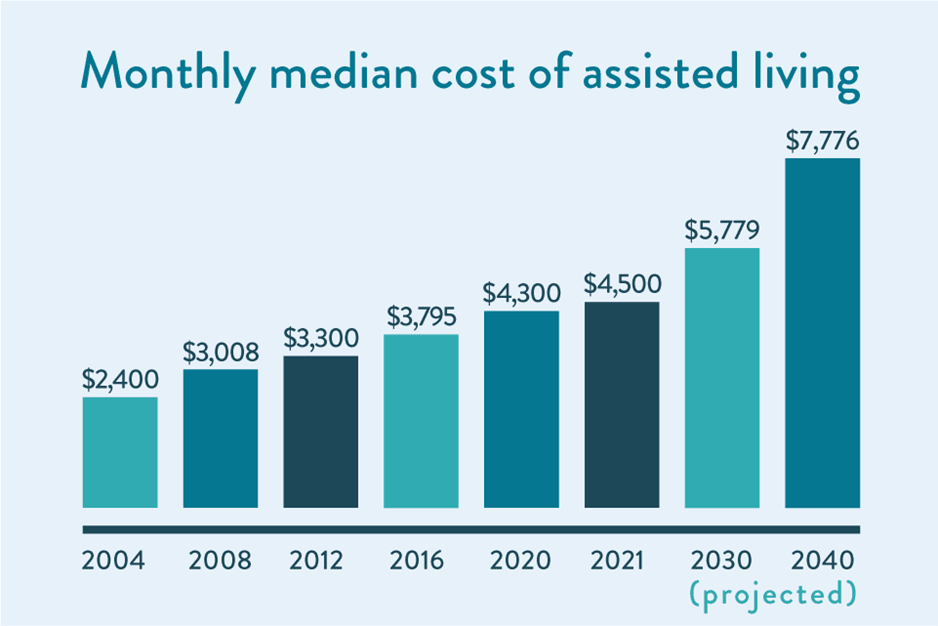
According to A Place for Mom’s proprietary data, the nationwide median cost of a one-bedroom assisted living apartment was $4,803 as of 2023. Assisted living costs vary greatly, depending on facility amenities, real estate markets, and geographic location. For example, the median 2021 cost of care in Missouri was $3,000, while care in the District of Columbia was nearly $7,000 a month.
Assisted living costs have risen starkly over the past two decades — Genworth’s first annual cost of care survey, published in 2004, cited just below $2,400 as the median monthly cost of assisted living. This upward trend is expected to continue — by 2030, Genworth estimates the national median cost of monthly care will be $5,779, and it may reach $7,776 by 2040.
How do assisted living communities determine pricing?
Pricing should be determined before a loved one moves into an assisted living community. Before families sign a contract, they’ll be able to see a breakdown of care costs. Most communities charge flat monthly rates, while some may offer a la carte pricing based on services required.
Community move-in fee: Many assisted living communities charge a lump-sum move-in fee. This cost generally ranges from $1,000 to $5,000 and can be paid upfront or in prorated increments over the first year of residence.
Monthly rent: Rent pays for a resident’s apartment and will vary based on size and features. For example, a shared two-bedroom apartment will likely cost less per person than a private, one-bedroom suite. Apartments with kitchens and separate seating areas will cost more than studios.
Services and amenities: Many assisted living communities offer breakdowns of services provided. Some services include:
Assistance with ADLs, including dressing, bathing, and medication management. Communities may charge by the hour for these services or may offer a flat rate based on a senior’s individual needs. A more independent resident may only need one hour of help each day for medication administration, while someone who requires more assistance may pay for three or four hours a day. Pricing for ADL assistance will likely change throughout the resident’s stay as care needs progress.
Meal plans, often put together by an on-site dietician or company specializing in healthy meals for seniors, generally range from $3-$10 a day and include three meals as well as snacks. Rarely, communities will allow residents to purchase meals à la carte.
Therapies and other services, like physical therapy, occupational therapy, and on-site salon visits, may have individual pricing.
Flat rates: Even if costs are broken down in contracts and monthly statements, residents generally pay one flat rate each month. A Place for Mom’s median monthly rate of $4,803 includes most amenities, meals, and assistance with ADLs.
How to pay for assisted living
Many families are surprised to learn that Medicare and Medicaid don’t typically pay for assisted living and that other types of insurance often only cover a small percentage of monthly rent. Most families use private funds to pay for assisted living. This means they use a combination of personal savings, pension payments, and/or retirement or investment income. Often, a senior’s children and family members pay a large share of elder care costs.
Paying for assisted living with insurance
It’s unlikely that insurance will cover a large part of assisted living care. However, some insurance benefits from Medicare, private insurance companies, long-term care insurance, and life insurance policies may apply:
Medicare only covers short-term, non-custodial care, so you can’t use it to pay for assisted living. However, a policy may cover some medical care, like dialysis or insulin injections, depending on a senior’s care needs.
Private insurance policies also generally only cover the medical costs of assisted living. Talk with your relative’s insurance agency to learn how to itemize costs.
Claire Samuels is a former senior copywriter at A Place for Mom, where she helped guide families through the dementia and memory care journey. Before transitioning to writing, she gained industry insight as an account executive for senior living communities across the Midwest. She holds a degree from Davidson College.
Reviewed by
Carol Bradley Bursack, NCCDP-certified dementia support group facilitator
The information contained on this page is for informational purposes only and is not intended to constitute medical, legal or financial advice or create a professional relationship between A Place for Mom and the reader. Always seek the advice of your health care provider, attorney or financial advisor with respect to any particular matter, and do not act or refrain from acting on the basis of anything you have read on this site. Links to third-party websites are only for the convenience of the reader; A Place for Mom does not endorse the contents of the third-party sites.